The best way to try to determine the market's direction is by using a lagging indicator such as a moving average. While one may lag a few months behind the event, the fact that one is using a hedged strategy means that the damage done once the market turns and before finally adjusting the net exposure should be minimal.
In using a moving average one is faced with a trade off. Using a short time period moving average will result in a faster response but will also generate a lot of false signals. Going to a longer time period moving average will give one less false signals but will result in a much longer delay.
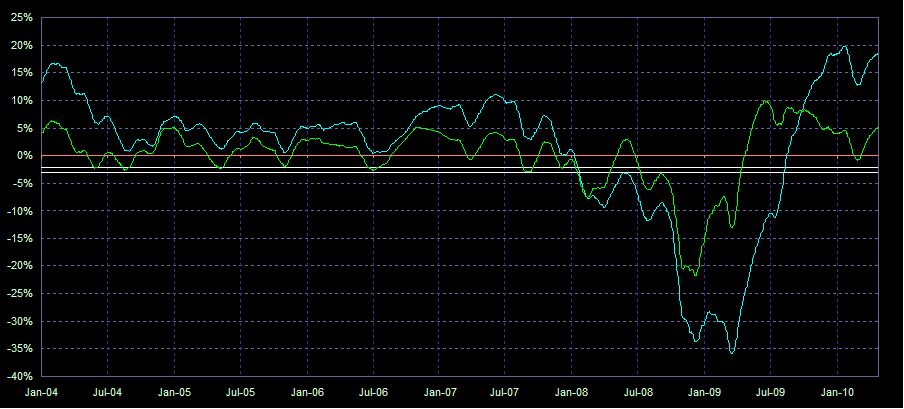
The green 100/20 day moving average trend lines are calculated by taking the difference between the 20 day moving average and the 100 day moving average and dividing the difference by the 100 day moving average. If the 100 day moving average is above the 20 day moving average the value is positive and if the 100 day moving average is below the 20 day moving average the value is negative.
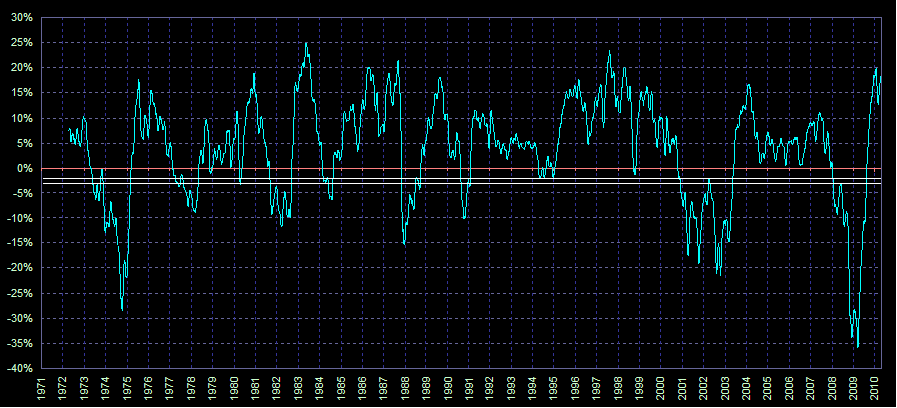
The blue 300/20 day moving average trend lines are calculated by taking the difference between the 20 day moving average and the 300 day moving average and dividing the difference by the 300 day moving average. If the 300 day moving average is above the 20 day moving average the value is positive and if the 300 day moving average is below the 20 day moving average the value is negative.
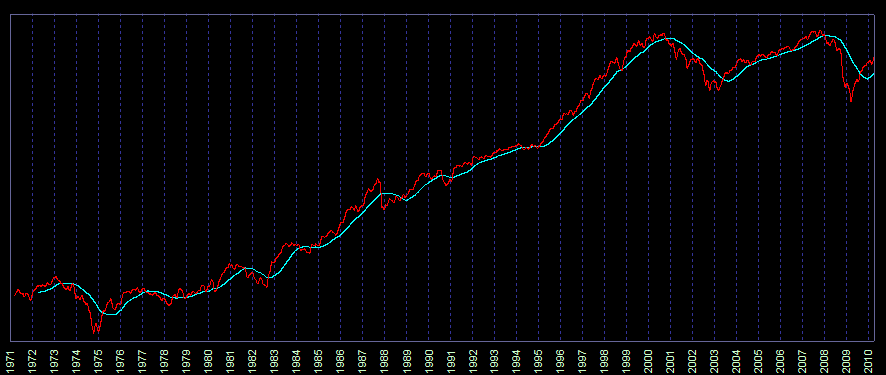
S&P 500 - 300/20 Day Moving Averages from 1971 to the present (Logarithmic) (
|
S&P 500 - 300/20 Day Trend Line from 1971 to the present
|
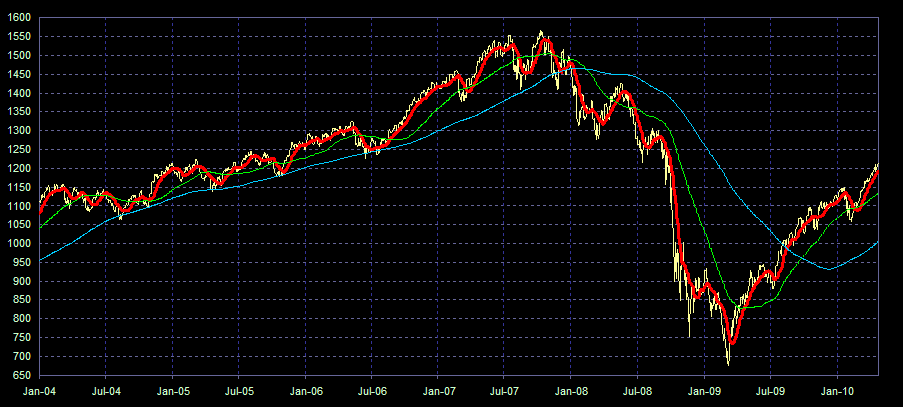
S&P 500 - 100/300/20 Day Moving Averages from 2004 to the present
|
| S&P 500 - 100/20 Day and 300/20 Day Trend Lines from 2004 to the present
|